Significant improvement to loading times!
Thanks to #XertroV for improving the map monitor API.

| Downloads | 217 |
|---|---|
| Updated | 2 years ago |
| Released | 2 years ago |
| Created | 2 years ago |
| Numeric ID | 432 |
| Min. Openplanet | 1.26.0 |


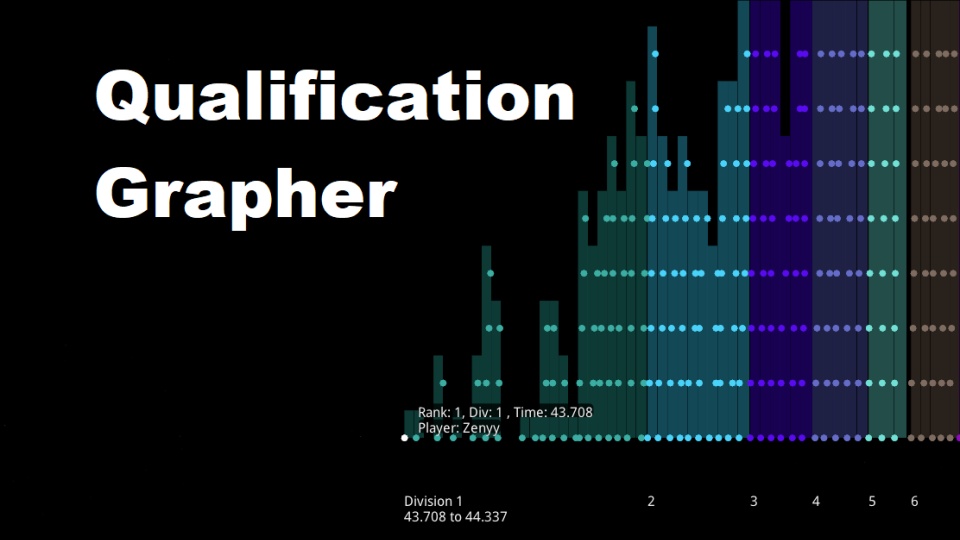
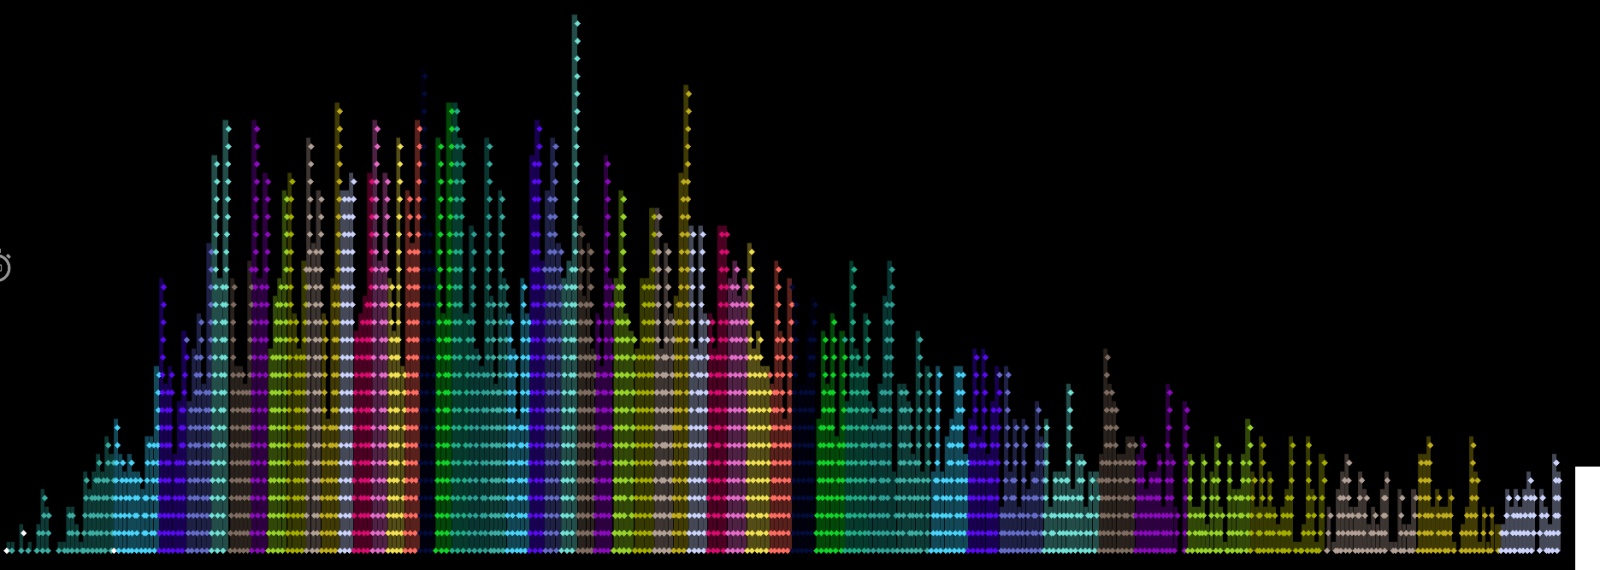
This plugin renders a scatter-histogram view of all COTD Main Qualifiers.
The plugin shows a histogram, color coded by division, where you can zoom in and click on each individual point to see information about that player.
Pan the graph down to see explicit division numbers and time cutoffs.
Click and drag on an empty part of the graph to pan the graph, and use your mouse wheel to zoom.
To remove labels, right click on the given division, or right click anywhere outside of the graph.
To reset the graph view, right click on a blank portion of the graph.
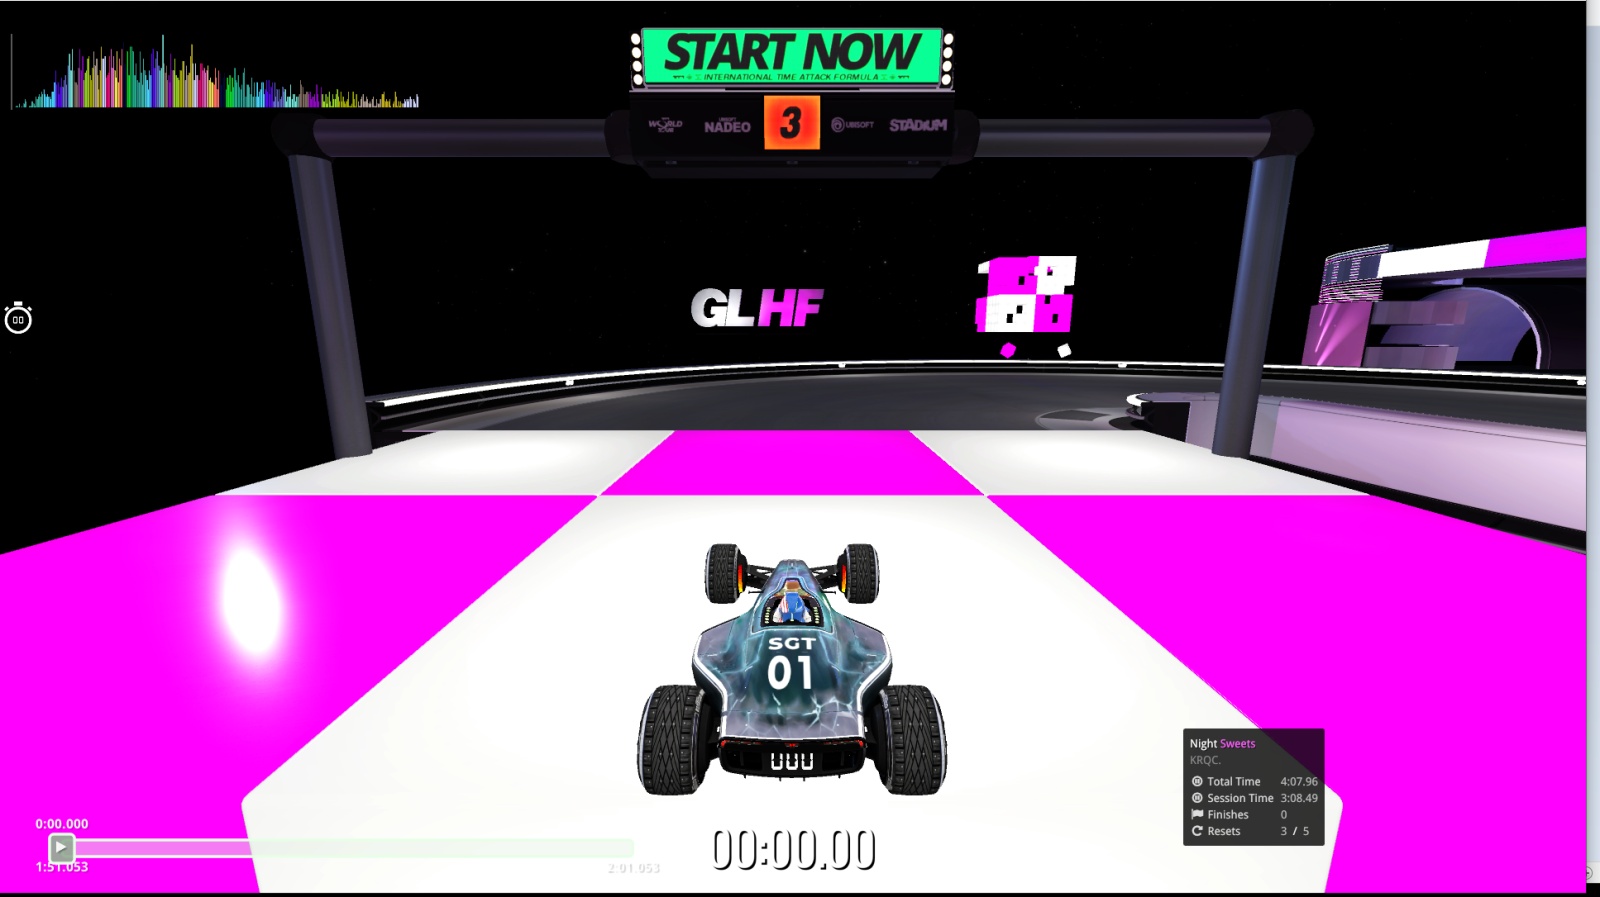
To resize the graph, hover over the edge until you see a white border, then click and drag the corner or the side of the graph.
To see explicit division labels, zoom in on the bottom of the graph. Note: Text is hidden if there isn't enough space for it to fully render, so you may have to zoom in significantly.
Your personal best time is shown as a white line.
Help text is available in the settings.
Performance recommendations:
Feature requests and bug reports are welcome.
Known issues:
Significant improvement to loading times!
Thanks to #XertroV for improving the map monitor API.